Let’s start with a tale of two charts. Or rather, one chart.
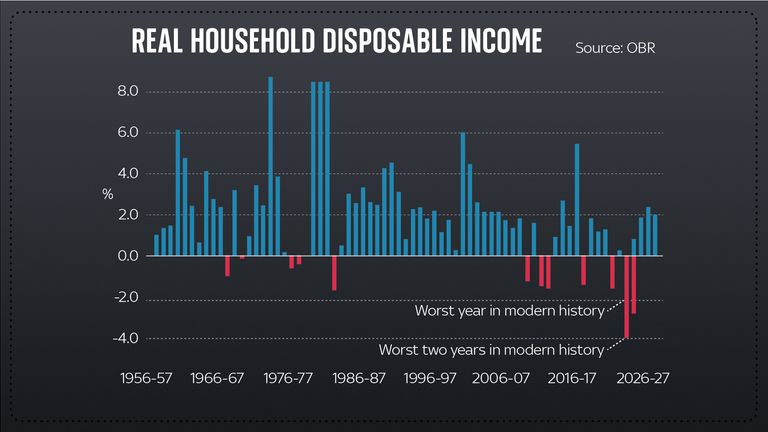
Be warned: it’s not a pretty chart. It shows how average household disposable income changed each year since 1955 and for the most part it’s a story of progress.
As the years have gone on, we have seen our disposable incomes rise in most years.
But here’s where it gets gritty, because that run is about to come to a crashing end. Back in March, the Office for Budget Responsibility produced this chart, and it showed the single worst year for disposable income changes since records began in the 1950s.
Back then, Rishi Sunak was chancellor and behind the scenes he was furious with the OBR. Why did they ruin his finely honed spring statement with their chart of misery?
Now roll forward to today. The OBR updated the chart for the autumn statement and the prognosis was even worse.
Now we are facing not just the worst year for household disposable income in modern history, but the two worst years, one after another. It is about as grim as you could imagine.
And if there’s one chart you want to bear in mind over the coming months as households face a squeeze the likes of which they rarely ever have, and many are pushed closer than ever before towards penury, it’s this one.
However, this time around, far from being furious about the publication of the chart, the Treasury has effectively embraced it. And this change in attitude tells you rather a lot.
Whereas Mr Sunak once wanted to play down the economic misery facing the country, today he wants to emphasise it.
The government wants everyone to know how tough things are because the fiscal remedies it’s implementing in the autumn statement would be doubly unpalatable without some sort of justification.
The rationale in Whitehall is that if people realise how miserable the economic climate is, they might be more willing to put up with another dose of fiscal contraction.
It’s worth saying, however, that the squeeze priced in within the autumn statement is not quite as tough as the pre-event leaks might have suggested
In numerical terms, at least, this is not the austerity we saw during the Osborne years. But for many government departments already cut to the bone, it will feel pretty brutal all the same.
For education and the NHS, there were unexpected increases in funding – but inflation is likely to eat into those increases very quickly indeed.
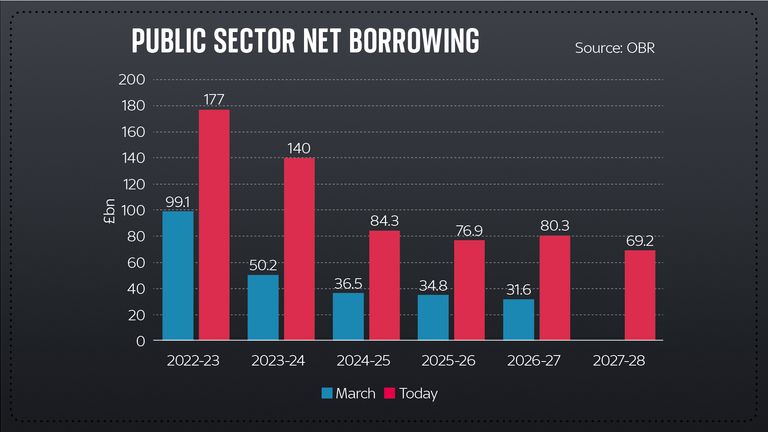
However, take a step back and look at where the public finances land in five years’ time. Back in March, the plan was to get public sector net borrowing down to £31.6bn by 2026/27. As of the autumn statement, the plan is to get it down to only £80.3bn.
Back in the day, this would have been considered a high budget deficit – above 2% of gross domestic product. Fiscal conservatism this ain’t.
But for all the talk of austerity and cuts, the reality is that the chancellor didn’t cut quite as much as some had expected.
This is not to say there is much joy coming our way from the Exchequer: there will be an average of £55bn of contraction – all to fill in the much-vaunted black hole which some economists argue never really existed.
Read more:
Autumn statement key points at a glance
Millions to pay more in tax after autumn statement
All the hallmarks of a Labour budget | Beth Rigby
But had the chancellor wanted to get the public finances back to where they were supposed to end up as of March, it would have involved an extra £50bn of cuts – truly grisly austerity.
This was, in one sense, a very middle-of-the-road fiscal event: decidedly boring, decidedly unshowy and decidedly lacking in surprises. It reads less like an economic philosophy than an effort to clean up a mess.
Much of the documents are devoted to accounting for how the potential promises of the Truss era ballooned the public finances in one direction, before being yanked back towards earth in the Sunak era.
The question now is whether unwinding all that spaghetti will actually help the Conservative Party rebuild its trust with the British public.
And, most of all, the question is how the public will fare over the coming months.
The OBR’s forecasts paint a picture of a recession unlike most we’ve felt for a long time – a recession not of the business sector or the financial system, but one that hits consumers square in the pocket.
It’ll be a very painful few months. The difference is that this time around, the government isn’t afraid of charts telling you precisely that.


